Observability
The incident that changed how I thought about this
Section titled “The incident that changed how I thought about this”For two years I thought “observability” meant “adding more logs.” We had a production incident where the logs were complete — every request logged, every error logged, every database call logged. I could scroll through them and see exactly what had happened. And I still couldn’t tell why the service was slow.
The problem: I knew what happened. I didn’t know where time went. That’s a different question, and logs don’t answer it well. Distributed tracing exists specifically to answer it.
The three signals and what each answers
Section titled “The three signals and what each answers”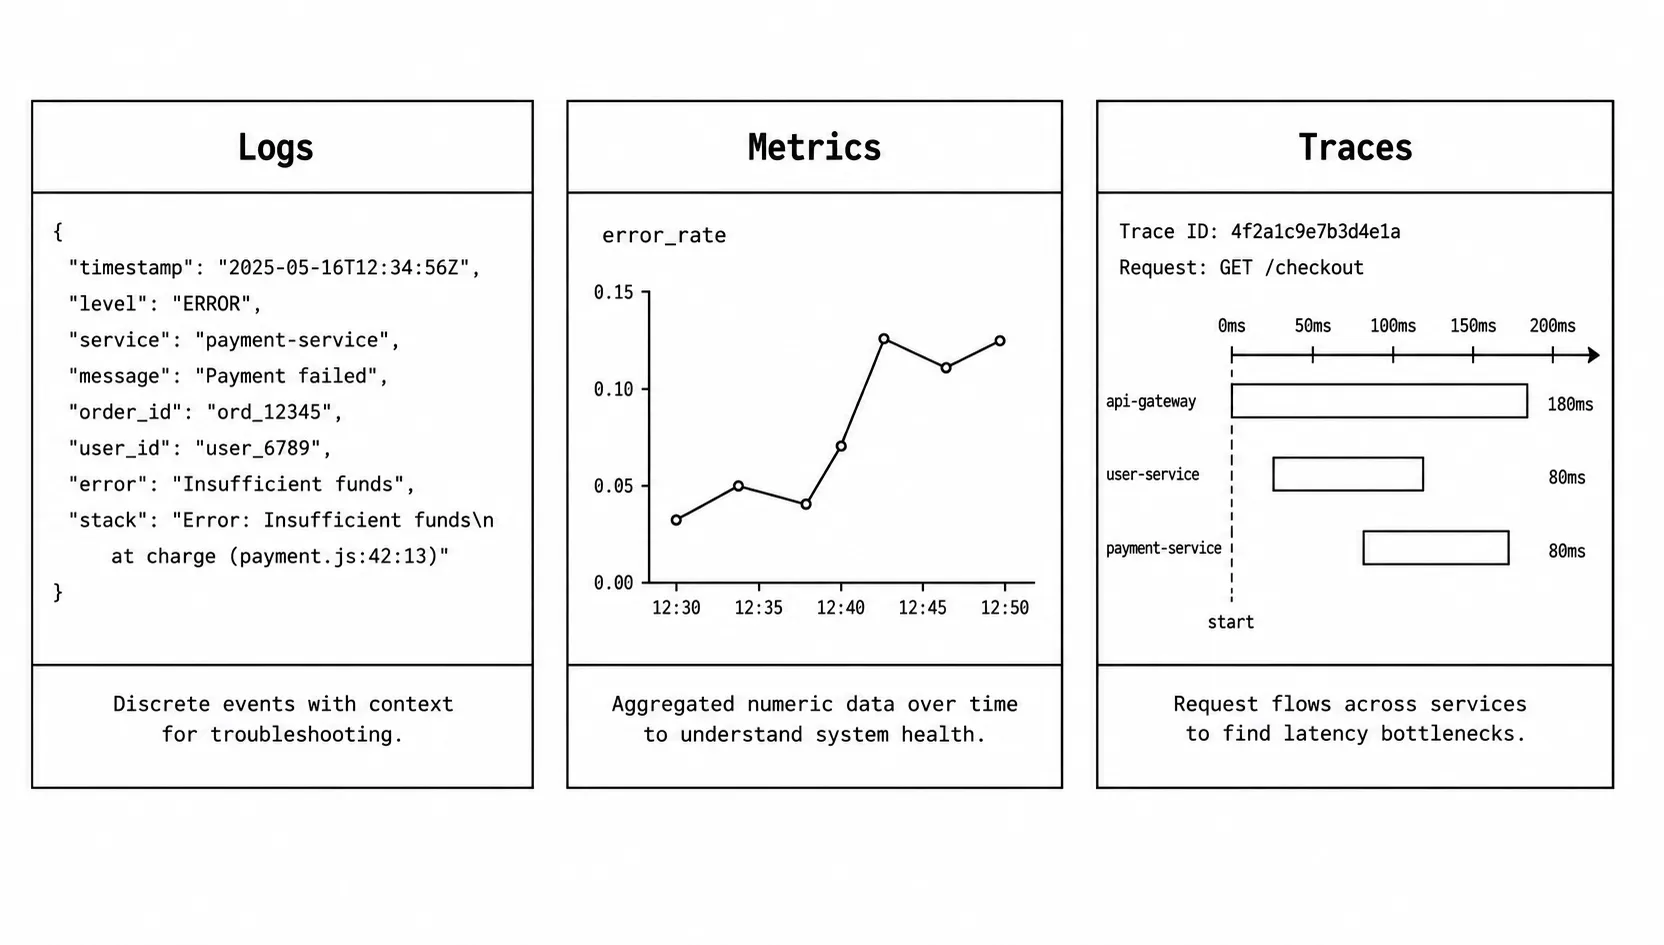
Logs answer what happened. They’re the event record — a request arrived, a query ran, an error was thrown. Good for debugging a specific known event when you already know roughly when it happened. Bad for answering “is this slow right now?” or “which service is causing latency?”
Metrics answer how much / how often. Request rate, error rate, latency percentiles, queue depth, CPU usage. Good for dashboards, alerts, and spotting trends. Bad for understanding why a specific request was slow.
Traces answer where time went in a specific request. A distributed trace follows a request across service boundaries, capturing how long each span took. Good for finding which service, which database query, or which downstream call is causing latency. Bad for high-cardinality queries (you can’t trace every one of 100k requests per second).
The reason all three exist: they answer different questions, and the right signal depends on what you’re trying to find out.
Structured logging
Section titled “Structured logging”The transition from unstructured to structured logging is one of those things that feels like overhead until you’re searching logs at 2am.
Unstructured:
[2026-08-30 14:23:01] ERROR: database connection failed for user 4821Structured (JSON):
{ "level": "error", "timestamp": "2026-08-30T14:23:01.412Z", "message": "database connection failed", "userId": 4821, "database": "orders-primary", "durationMs": 5003, "retryCount": 3, "traceId": "abc123def456"}The difference in practice: with structured logs you can filter by userId: 4821, aggregate by database, plot durationMs over time, and join log events to traces via traceId. With unstructured logs, you’re running regex against strings and hoping the format is consistent.
The rule: always emit logs as structured JSON in production. Use a human-readable format locally where you’re reading them directly. Most logging libraries support both modes with a config flag.
What to always include:
- timestamp — in UTC, with millisecond precision
- level — error, warn, info, debug
- message — a static string that describes the event type, not the full detail (the detail goes in fields)
- traceId / requestId — connects this log to the request that produced it
- service name and version — when aggregating logs from multiple services
What not to log: passwords, tokens, full request bodies from authenticated endpoints, PII beyond what’s necessary for debugging. Logs often go to systems with broader access than the service itself.
The cardinality trap in metrics
Section titled “The cardinality trap in metrics”Metrics are counters, gauges, and histograms with labels (or tags or dimensions — different systems use different words). Labels let you slice a metric by relevant dimensions.
http_requests_total{method="GET", status="200", endpoint="/api/users"}The cardinality trap: the number of unique label value combinations determines how many time series the metrics system stores. Low cardinality is fine. High cardinality breaks everything.
Safe labels: method (GET, POST, etc), status (200, 400, 500), region (us-east-1, eu-west-1), service_version.
Dangerous labels: user_id, session_id, request_id, customer_name. These have unbounded cardinality. For a service handling 1 million users, user_id as a label creates 1 million time series for a single metric. Most metrics systems degrade severely above a few million active series.
The pattern that works: use structured logs (with traceId) for per-request data. Use metrics for aggregated signals. Traces for per-request timing. Each tool for what it’s designed for.
Distributed tracing
Section titled “Distributed tracing”A trace is a tree of spans. Each span represents an operation — handling an HTTP request, executing a database query, calling a downstream service. Spans have a start time, duration, status, and arbitrary attributes.
Request: GET /api/order/1234 450ms └─ Auth middleware 3ms └─ Fetch order from database 120ms └─ SQL: SELECT * FROM orders 2ms └─ SQL: SELECT * FROM line_items 118ms ← here's your problem └─ Fetch shipping status (external API) 310ms ← or here └─ Serialize response 4msWithout a trace, “this endpoint is slow” is everything you know. With a trace, you know it’s slow because a specific SQL query or external API call is taking most of the time. That’s the difference between a 30-minute investigation and a 2-minute one.
The propagation model: the calling service generates a trace ID and a span ID, passes them in request headers (traceparent in the W3C standard, or service-specific headers in older systems). The downstream service reads the headers, creates a child span, and passes the context further. At the end, all spans with the same trace ID can be stitched back into the full tree.
OpenTelemetry is the current standard for instrumentation — it’s vendor-neutral and supported by every major backend (Jaeger, Zipkin, Honeycomb, Datadog, Grafana Tempo). Instrumenting your service means initializing the SDK, then either using auto-instrumentation (which wraps common libraries like HTTP clients and database drivers) or manually creating spans for the operations you care about.
import { trace } from "@opentelemetry/api";
const tracer = trace.getTracer("order-service");
async function fetchOrder(id: string) {  return tracer.startActiveSpan("fetchOrder", async (span) => {    span.setAttribute("order.id", id);    try {      const order = await db.query("SELECT * FROM orders WHERE id = $1", [id]);      span.setStatus({ code: SpanStatusCode.OK });      return order;    } catch (err) {      span.setStatus({ code: SpanStatusCode.ERROR, message: String(err) });      throw err;    } finally {      span.end();    }  });}
When observability isn’t the problem
Section titled “When observability isn’t the problem”There’s a failure mode where teams add more logging, more metrics, more dashboards, and still can’t understand production. Usually this means the system design has problems that observability is revealing but not solving.
A service that calls 20 downstream services has a complex trace. Fixing the trace visualization doesn’t fix the coupling. A database with 500 slow queries a day generates useful metrics. Fixing the dashboard doesn’t fix the missing indexes or the N+1 queries.
Observability is a feedback mechanism. It’s most valuable when the system is designed well enough that the signals point at solvable problems. Adding observability to a poorly designed system will tell you clearly that the system is poorly designed.
Interview angles
Section titled “Interview angles”“What’s the difference between logs, metrics, and traces?” Logs record events (what happened). Metrics aggregate numerical signals over time (how much, how often). Traces record the path and timing of a specific request across services (where time went). They answer different questions, which is why you need all three.
“What is cardinality in the context of metrics?” The number of unique combinations of label values. Low-cardinality labels (status code, HTTP method, region) are safe. High-cardinality labels (user ID, session ID, request ID) create too many time series and degrade the metrics system. Per-request data belongs in structured logs with a trace ID linking them to the relevant trace.
“How does distributed tracing work?” The first service in a request chain generates a trace ID and a span ID. These propagate through request headers to downstream services. Each service creates child spans under the parent. At the end, all spans with the same trace ID are assembled into a tree showing how long each operation took and in what order. This makes it possible to identify which service or query is responsible for latency in a multi-service system.